Optimize office use with actionable data
Stop planning your office around bookings, assumptions, or one annual utilization report. Yoffix shows how your space is actually used—by floor, zone, team, and day—so you can adjust it with confidence.
70% average office utilization
90% tool adoption
Over 1,000 clients
The challenge
You have the data. But can you trust it?

Most companies measure workplace usage. The problem is that their data rarely tells the full story. Badge swipes show that someone entered the building. Booking systems show what people planned to use. Neither reliably shows where people actually worked or which days create the real demand.
Badge data shows building entry, not desk or floor usage
Bookings show reservations, not actual presence
No-shows make demand look higher than it is
Weekly averages hide the busiest days that determine desk supply
Outcome: Space decisions are difficult to make and get pushed to the next lease renewal.
Turn occupancy data into decisions
Yoffix combines reliable presence data with clear, actionable reporting. You get a realistic view of office usage and the evidence to make better decisions about space, costs, and workplace policies.

Track presence, not intentions
A desk only counts as used when someone checks in. If they do not show up, it becomes available again automatically. Badge data, WiFi signals, and HR absence information can add further context. With adoption rates of 90% or more, your data reflects the office people actually use—not the one they planned to use.
Check-in windows and automatic release of no-shows
Badge and WiFi signals
Absence data from Personio, Workday, HiBob, and more

Know where demand is highest
See utilization by floor, zone, team, and day. Compare average usage with peak demand instead of hiding both in one number. Heatmaps reveal the quiet areas and the spaces people compete for. Scheduled reports put the right information in front of leadership, finance, and workplace teams.
Average and peak utilization shown separately
Zone-level heatmaps for every location
Automated reports for leadership and finance
Make better decisions with better data
Consolidate with confidence
Close or repurpose the zones your data shows are consistently underused. Customers can save up to 30–50% of their office space.
Set the right desk ratio
Plan desks around measured demand, not employee headcount or guesswork. Run your numbers in our calculator.
Reduce midweek overcrowding
Coordinate team anchor days to spread demand and stop Tuesday from overflowing.
Lower running costs
Match cleaning, heating, cooling, and energy use to the floors people actually use.

Adjust your office throughout the year
You do not need to wait for a lease renewal to improve your workplace. After four to six weeks, you can identify day-to-day usage patterns and adjust desk ratios, cleaning, or layouts. For decisions about floors and leases, measure for eight to twelve weeks to account for holidays and quarter-end fluctuations. Then repeat the process as demand changes.
Monthly: review desk ratios, cleaning, and zone layouts
Quarterly: evaluate floors, leases, and consolidation options
Continuously: monitor anchor days and team overlap
Easily integrate your existing data sources
Microsoft 365
Let employees book and check in directly through Teams and Outlook with Entra ID sign-in.
Google and Slack
Sync calendars and manage bookings for teams in your preferred environment.
HRIS
Integrated with SAP SuccessFactors, Workday, and 20+ HRIS to sync HR flows and office management.
Occupancy sensors
Bring presence data from partner sensors directly into your reports.
Badge and WiFi data
Add existing building signals as an optional layer of accuracy.
Export and API
Send anonymized data to your BI tools or custom dashboards.

Data your works council can review
Workplace analytics should show that 18 desks were used on the third floor on Tuesday—not who used them. Yoffix aggregates data by default and lets you set minimum group sizes before a figure appears.
Anonymous mode and configurable minimum group sizes
ISO 27001:2022 certified and GDPR-compliant
Made and hosted in Germany, private cloud and regional hosting available
Works council compliant with documentation for review
Manage with ease
One system to run your entire office
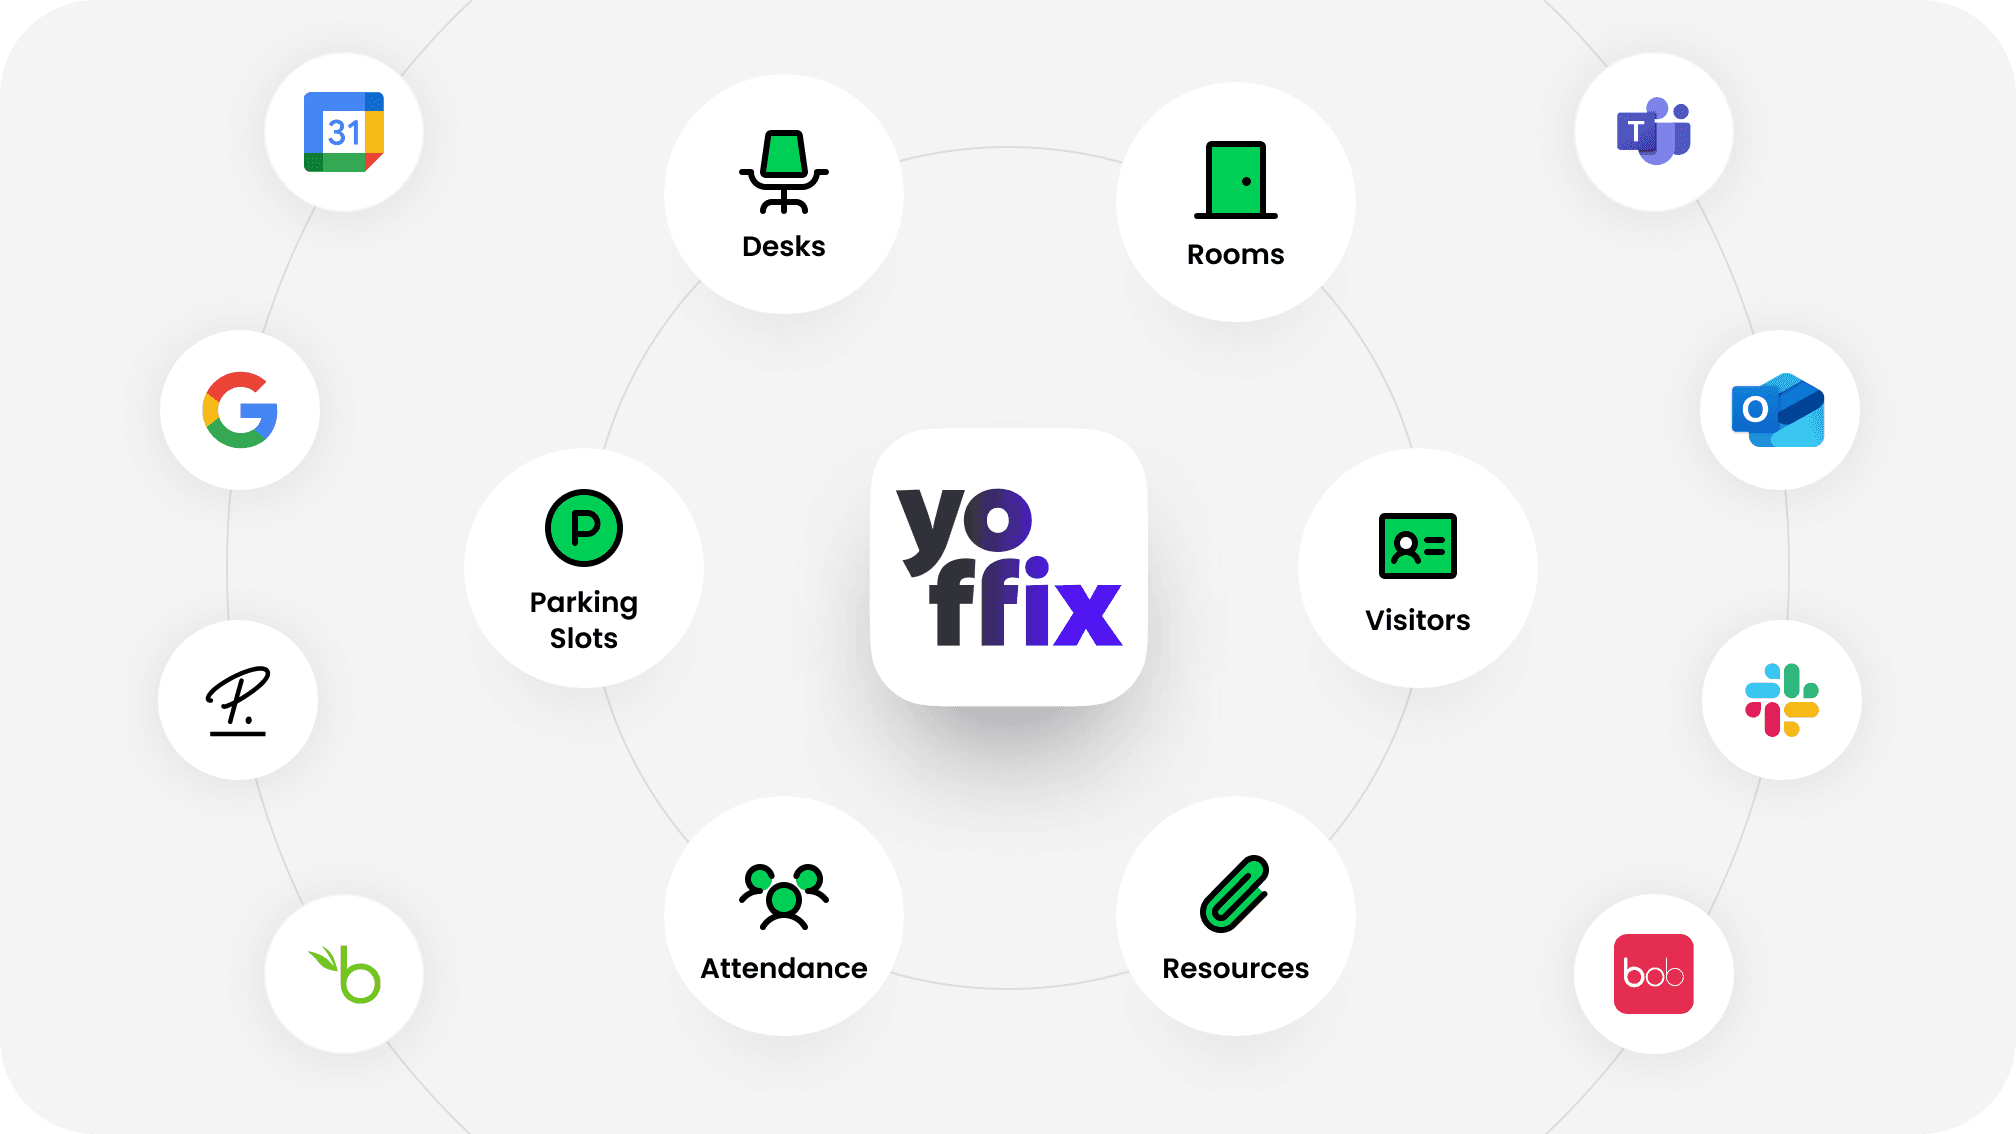
Everything in one place
Desks, rooms, parking spaces, lockers, resources, visitors, and office requests are all managed in one admin interface. One set of rules, one dashboard, one source of truth.
Eliminate complexity
Employees book and coordinate directly from Microsoft Teams and Outlook, using tools they already know. No new app to learn, no separate login, no behavior change required.
Insights that compound
Every booking, check-in, and sensor reading becomes utilization data. Over time this tells you exactly how your office is used and where to optimize, without manual reporting.


Award-winning workplace management app




4.8
4.8
Find out what your office data can tell you
See what your booking, badge, and occupancy data already reveals about the space you pay for.
Get a custom quote for your workplace
Every office is different. Tell us about your setup – the number of users, the features you need, or any other special requirements. We'll send you a tailored proposal with pricing, implementation timeline, and answers to your questions.
Response within 24 hours
Custom pricing based on your needs
No obligation


